
Ethereum Struggles Above $1,800 Support And Threatens To Fall
Ethereum (ETH) price has not changed in the interval between the moving average lines.
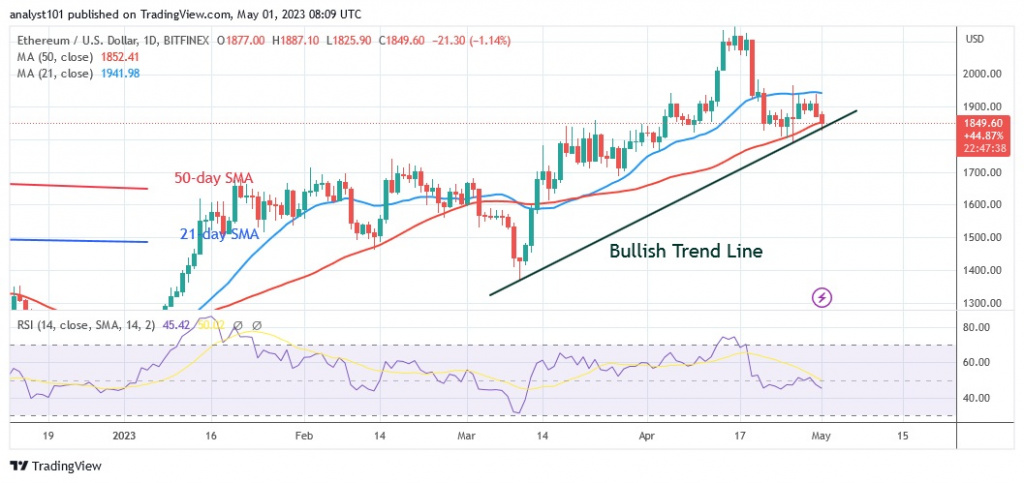
Long-term analysis of the Ethereum price: bearish
Since April 21, neither the bulls nor the bears have broken the moving average lines. Today the bears tried to break the 50-day line SMA, but they failed. The largest altcoin is currently trading at $1,849.80. If the bears manage to break the 50-day line SMA, Ether will fall to a low of $1,700. Positive momentum will resume if the altcoin crosses the 21-day line SMA. However, if the moving average lines are intact, Ether will continue to be trapped inside these lines. In other words, the crypto asset’s price will fluctuate between $1,800 and $1,900.
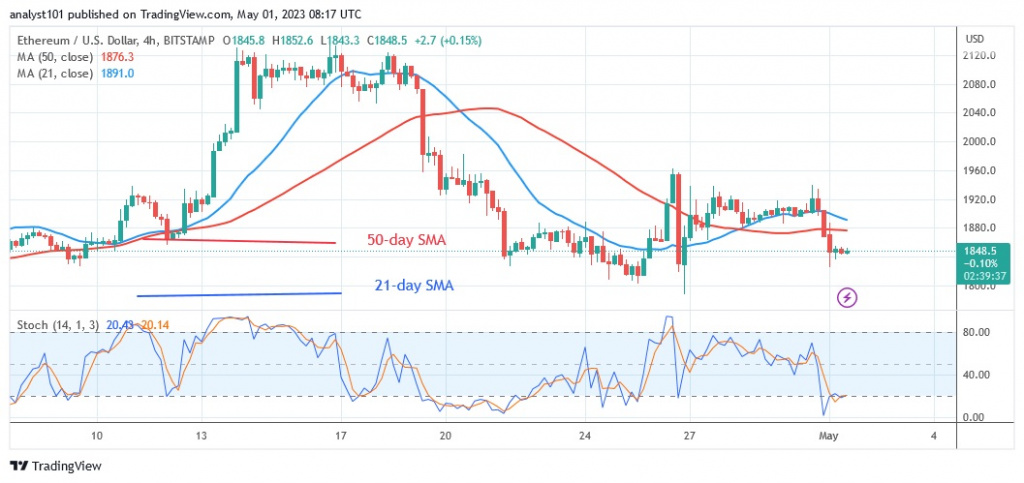
Analysis of Ethereum indicators

On the Relative Strength Index for period 14, Ether is at level 45. The altcoin is in a bearish trend zone and could fall. As long as the price bars are between the moving average lines, the cryptocurrency asset will fluctuate. Ether is currently trading in the oversold zone of the market. The daily stochastic is currently below the 20 level.
Technical indicators:
Key resistance levels – $2,000 and $2,500
Key support levels – $1,800 and $1,300
What is the next direction for Ethereum?
Ethereum has been moving between $1,800 and $1,900 since April 21. The largest altcoin has yet to trend as it is still trapped. Long tails are breaking below the 50-day line SMA on the daily chart, indicating active buying at lower price levels.
Disclaimer. This analysis and forecast are the personal opinions of the author and are not a recommendation to buy or sell cryptocurrency and should not be viewed as an endorsement by CoinIdol. Readers should do their research before investing in funds.
Source: Read Full Article