Cardano At Risk Of Falling 8% If It Doesn't Hold Above Key Support Line
The Cardano price surged as it broke through a critical resistance trendline on its chart, a few days ago. However, the bullish momentum was short-lived, and ADA has since lost 0.5% of its value on the daily chart. The past week saw a significant depreciation of 14% in ADA’s value, with demand and accumulation both falling.
As Bitcoin retraces on its chart, most altcoins have followed the same price direction. The technical outlook of the altcoin has also sided with the bears.

For Cardano to regain momentum, buying strength needs to pick up over the next trading sessions. However, another push from the sellers can potentially cause ADA to lose its local support level, leading to a considerable fall in prices.
Related Reading: MATIC Below Key Support Levels: What’s Next?
Cardano has also formed a v-shaped top reversal pattern, indicating a decline in demand over the last trading sessions. The market capitalization of Cardano has fallen, suggesting increased sell orders at the time of writing.
Cardano Price Analysis: One-Day Chart
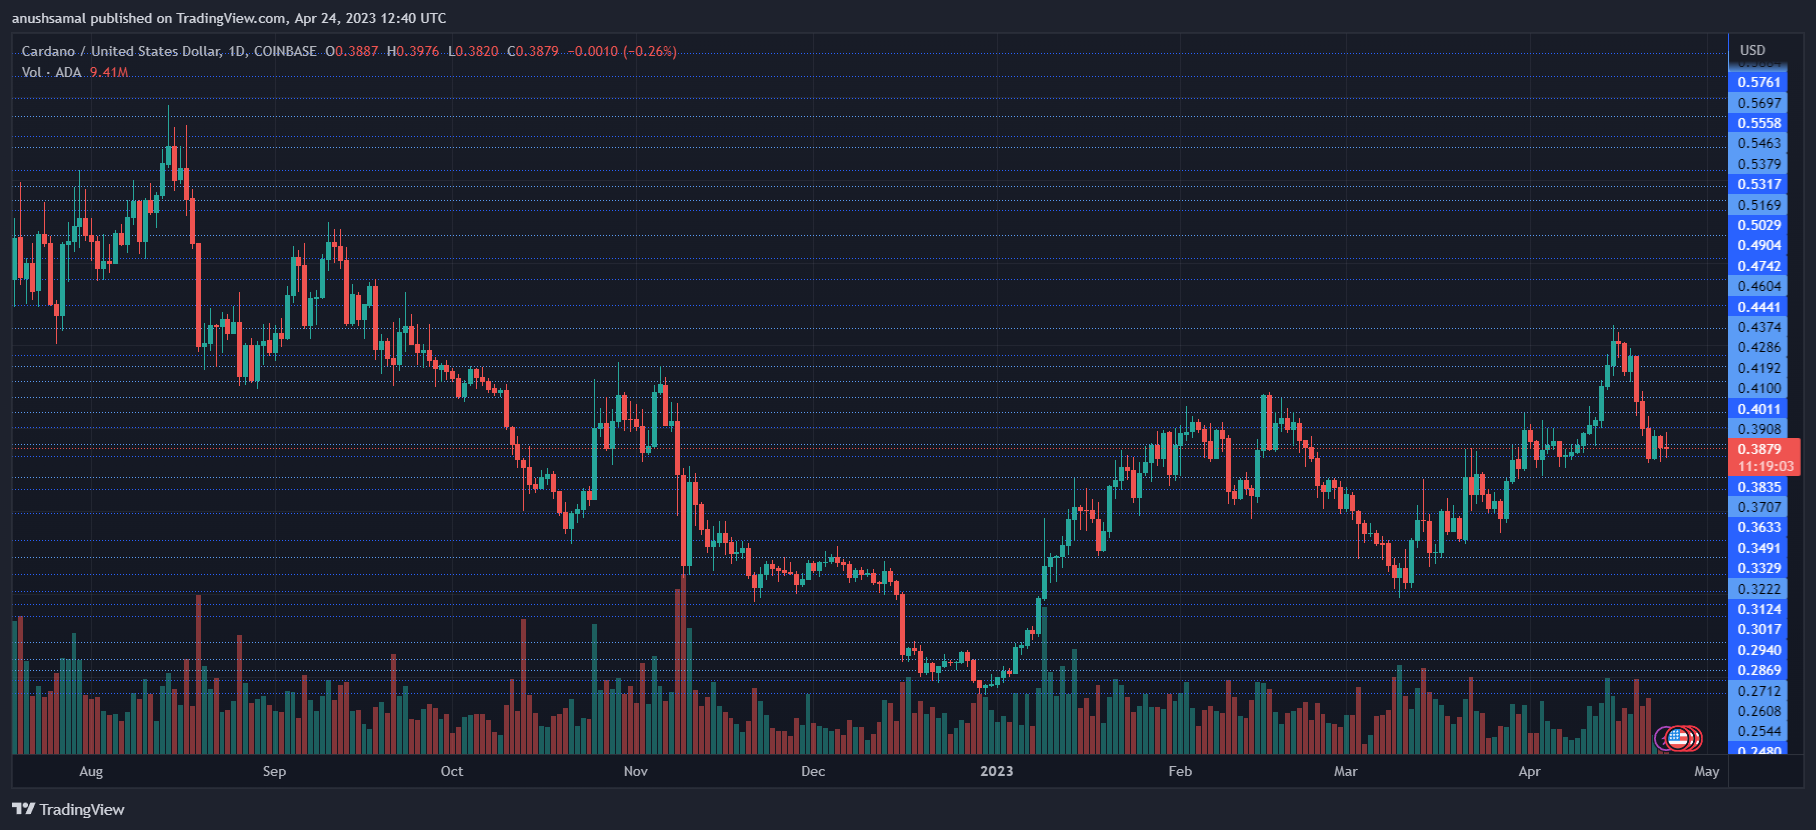
At the time of writing, ADA was trading at $0.38, experiencing a significant drop since losing the $0.40 price mark. Overhead resistance for the altcoin is currently at $0.40 and then at $0.42. Breaching the $0.42 price level could trigger bullish momentum.
However, if Cardano fails to maintain its price above the immediate support level of $0.37, the bears could push the price down to $0.35. In the last trading session, the amount of Cardano traded was red, indicating that selling pressure had increased at press time.
Technical Analysis
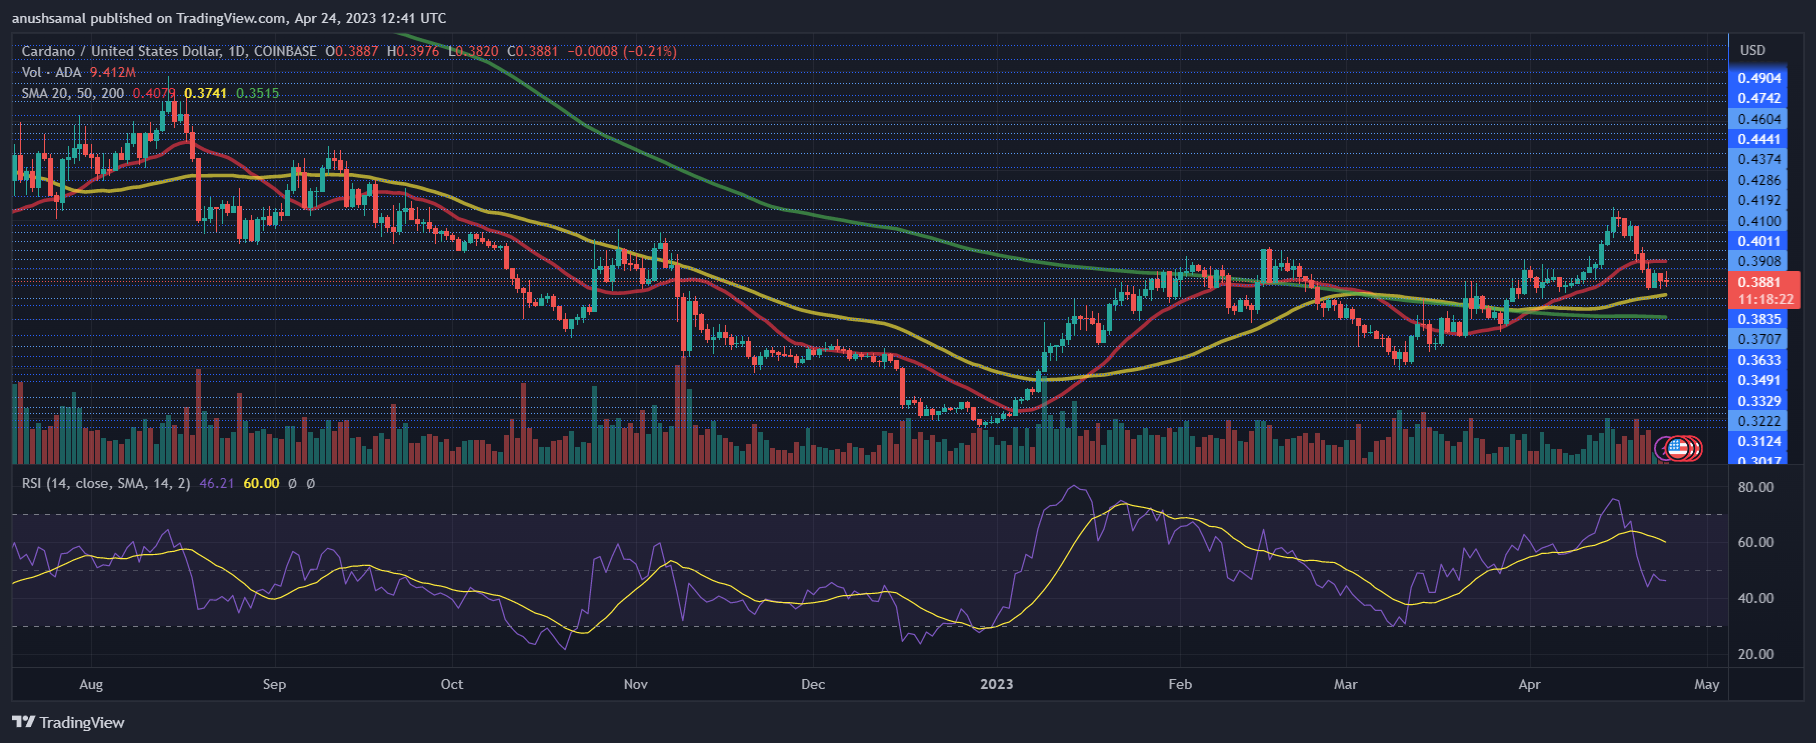
Demand for Cardano has seen a steep decline following its loss of the $0.40 support line. At the time of writing, the Relative Strength Index (RSI) was parked below the 50-mark, forming a downtick, indicating that sellers had outnumbered buyers.
Similarly, Cardano has fallen below the 20-Simple Moving Average line, implying that sellers are driving the price momentum in the market. Reclaiming the $0.40 mark could help Cardano rise above the 20-SMA, potentially aiding the coin’s recovery.
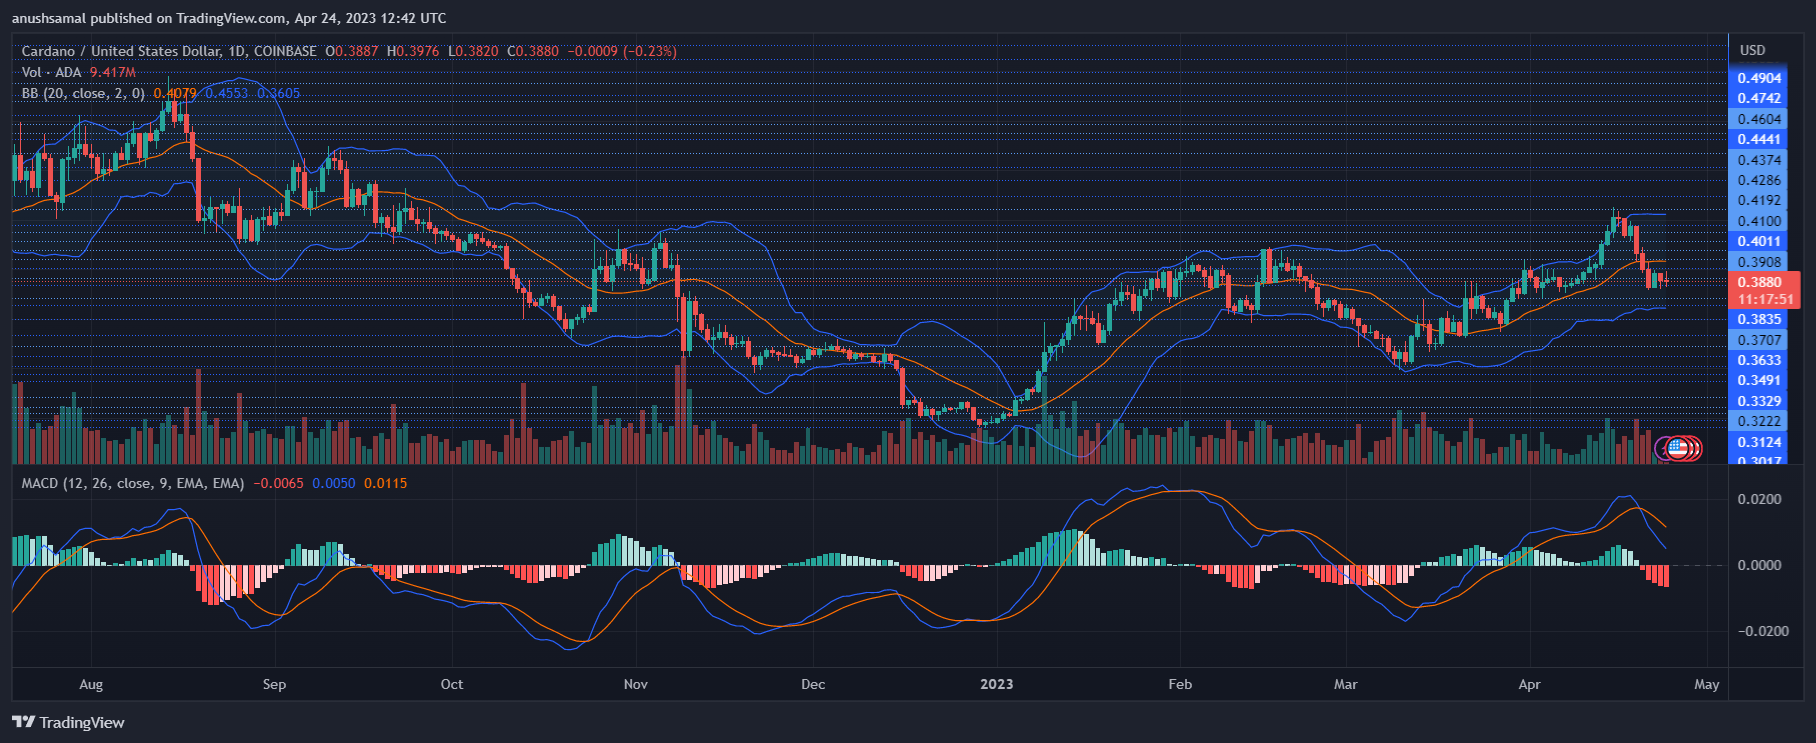
At the time of writing, Cardano’s technical indicators showed sell signals in accordance with other indicators. The Moving Average Convergence Divergence (MACD) indicated the price momentum and trend reversals via red histograms.
These histograms are associated with the coin’s sell signal, indicating that the price could drop further before a reversal occurs.
Additionally, the Bollinger Bands, which measure price volatility and asset fluctuations, had opened up, signaling that Cardano may experience fluctuations.
The upper band of the indicator serves as a critical resistance level for the altcoin. Moreover, broader market sentiment remains a significant factor influencing the asset’s price direction.
Source: Read Full Article