
Toncoin (TON) Continues Downward Trend As Bears Maintain Control
Toncoin (TON) has experienced a negative price decline, resulting in a bearish sentiment among investors of the altcoin. TON has been exhibiting a bearish strength on a monthly timeframe, based on data from CoinMarketCap.
Within the last 30-Day trading session, the asset is down by 15,67%, indicating a high bearish strength with low buying pressure.

As of the time of writing, the asset is experiencing a decline in value, as it’s down today by 2.76%. This downward trend has resulted in the asset, TON, reaching a low point of $1.91.
The decrease in value reflects a temporary setback in the market, indicating a decrease in investor confidence. It also detects a shift in the supply and demand dynamics surrounding the asset.
Toncoin (TON) Bears Maintained Their Positions
Toncoin (TON) witnessed a sharp price decline on May 23, from $2.03 to its present value of $1.89. This price decline represents a loss of 6.89%.
This decline reflects the dominance of bearish sentiment in the market, which shows a lack of investor confidence and a shift in the supply and demand dynamics.
According to the market sentiment indicator, the current market sentiment is bearish, while the Fear & Greed index value is a neutral 49. Notably, a Fear & Greed index value below 50 points to an increase in bearish momentum.

Conversely, an important resistance level is noted at $2.080, representing a significant hurdle for potential upward movement.
Toncoin trades below the 50-day and 200-day Simple Moving Average (SMA). The SMAs formed a Death Cross in the TON market on May 21, 2023.
This confirms the bearish sentiment present in the market, indicating a potential sell signal and further price decline.
The Relative Strength Index (RSI) momentum oscillator value is 40.98 and points downwards. RSI is a popular indicator showing whether a cryptocurrency is oversold or overbought.
If TON RSI drops below 30, it may ignite high selling pressure and further price decline.
TON Demand Index and Bollinger Bands Signals Bearish Activities
The TON/USDT trading pair demand index is at -0.449, suggesting relatively weak demand for the asset in the market.
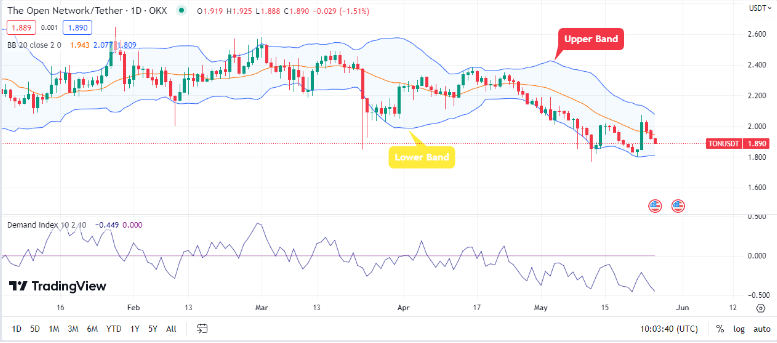
Note that a demand index below zero is generally considered a lack of buying pressure. It also indicates that the selling pressure outweighs the buying interest.
In addition, the asset is heading toward the lower part of the Bollinger Bands indicator. This suggests an increase in selling pressure and high bearish momentum.
Featured image from Pixabay and chart from Tradingview.com
Source: Read Full Article