
Ripple Recovers After Breaking Through Resistance at $0.34 and Targets High at $0.38
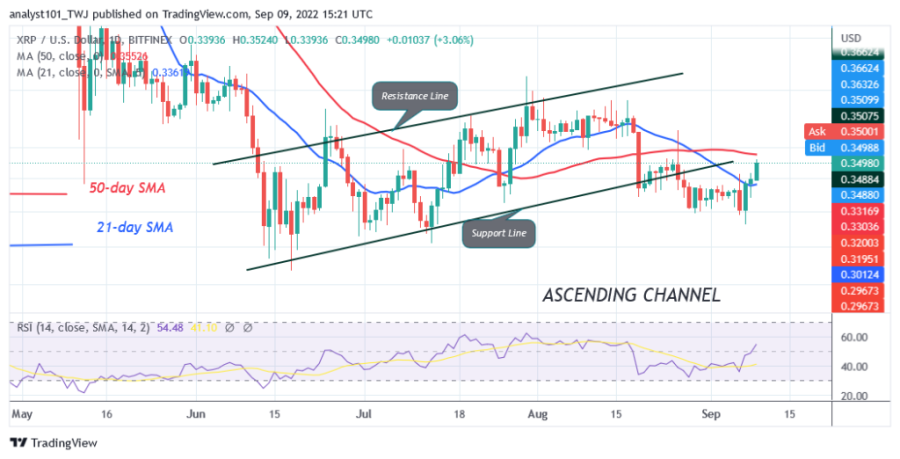
The price of Ripple (XRP) is moving positively as it has broken above the 21-day line SMA and resistance at $0.34. However, buyers need to keep the price above the 50-day line SMA to push XRP higher.
Ripple price long-term forecast: bearish
A break above the moving average lines will signal the resumption of the uptrend. XRP will rise and retarget the resistances at $0.39 and $0.41. In the meantime, XRP is trading between the moving average lines. The cryptocurrency will develop a trend if the moving average lines are broken. A break below the 21-day line SMA will cause the altcoin to fall to the $0.32 and $0.30 price levels. Nevertheless, the altcoin will be forced to move in a range where the moving average lines remain unbroken.
Ripple indicator analysis

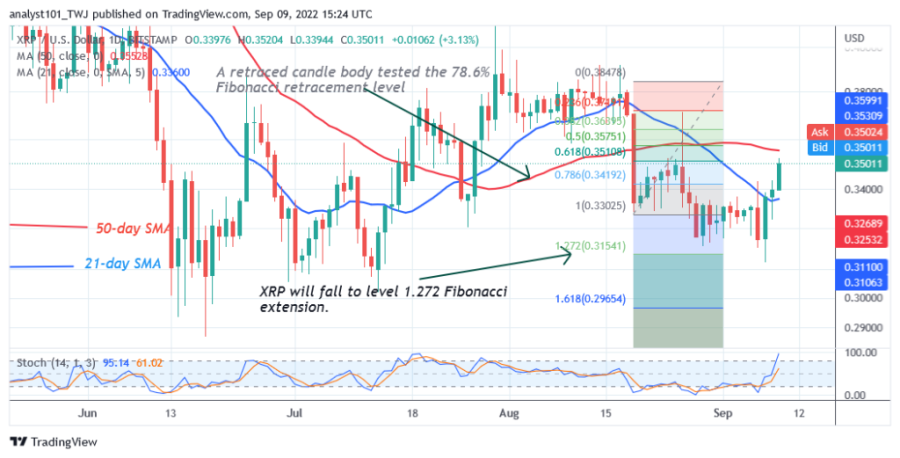
Ripple is at level 55 of the Relative Strength Index for the period 14. XRP is trading in the bullish trend zone due to the recent uptrend. The price of the cryptocurrency is between the moving average lines, which indicates that the altcoin will be forced to move within a certain range. The altcoin is above the 60% range of the daily stochastic. This indicates that XRP is in a bullish momentum. The 21-day line SMA and the 50-day line SMA are sloping north, indicating an uptrend.
Technical Indicators
Key resistance zones: $0.40, $0.45, $0.50
Key support zones: $0.30, $0.25, $0.20
What is the next move for Ripple (XRP)?
Ripple has left the downtrend after retesting the price levels of $0.30 and $0.31. Buyers are desperately trying to maintain the uptrend above the $0.39 and $0.41 resistance levels. The altcoin will be forced to move sideways if the resistance levels remain unbroken.
Disclaimer. This analysis and forecast are the personal opinions of the author and are not a recommendation to buy or sell cryptocurrency and should not be viewed as an endorsement by CoinIdol. Readers should do their own research before investing
Source: Read Full Article