
Bitcoin Price Rallies Past 30K, A Strengthening Case for Upside
Bitcoin price rallied above the $28,800 resistance. BTC is up over 6% and it could rise further above the $30,500 resistance zone.
- Bitcoin climbed higher and was able to clear the $30,000 resistance zone.
- The price is trading above $30,000 and the 100 hourly Simple moving average.
- There was a break above a bullish continuation pattern with resistance near $28,300 on the hourly chart of the BTC/USD pair (data feed from Kraken).
- The pair could extend its increase if it clears the $30,500 resistance level.
Bitcoin Price Gains Bullish Momentum
Bitcoin price formed a fresh support base above the $28,000 level. BTC started a strong increase and was able to clear the main $28,800 resistance zone.

Besides, there was a break above a bullish continuation pattern with resistance near $28,300 on the hourly chart of the BTC/USD pair. It opened the doors for a sustained upward move above the $29,200 resistance zone. The price rallied over 6% and was able to surpass the $30,000 level.
A new monthly high is formed near $30,431 and the price is now consolidating gains. Bitcoin price is trading above $30,000 and the 100 hourly Simple moving average.
The price is also positioned nicely above the 23.6% Fib retracement level of the recent surge from the $28,200 swing low to the $30,431 high. Immediate resistance is near the $30,450 level. The next major resistance is near the $30,500 zone.
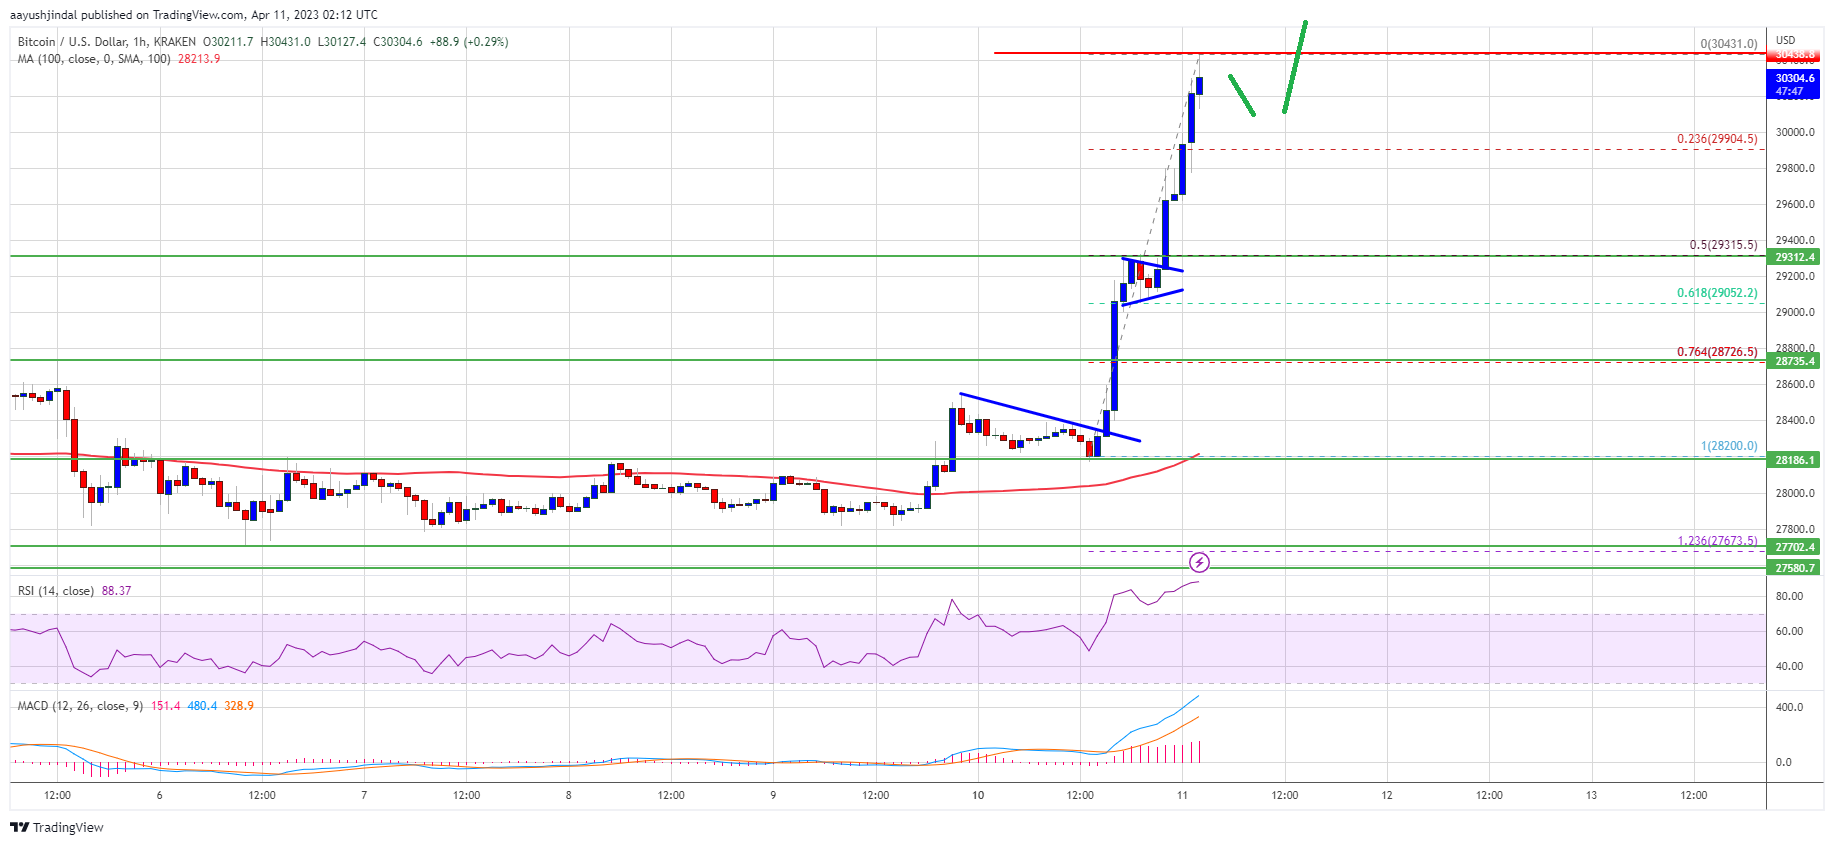
Source: BTCUSD on TradingView.com
A convincing move above the $30,500 resistance might push the price further higher. In the stated case, the price may perhaps rise toward the $31,200 level. The next key resistance is near the $32,000 level.
Dips Attractive in BTC?
If Bitcoin’s price fails to clear the $30,500 resistance, it could start a downside correction. Immediate support on the downside is near the $30,000 level.
The next major support is near the $29,200 zone and the 50% Fib retracement level of the recent surge from the $28,200 swing low to the $30,431 high. A downside break and close below the $29,200 support might push the price back toward $28,800. Any more losses might call for a drop toward the $28,000 support zone.
Technical indicators:
Hourly MACD – The MACD is now gaining pace in the bullish zone.
Hourly RSI (Relative Strength Index) – The RSI for BTC/USD is now in the overbought zone.
Major Support Levels – $30,000, followed by $29,200.
Major Resistance Levels – $30,450, $30,500, and $31,200.
Source: Read Full Article