Quant Rallies To $120 High While Trapped In A Range
Quant (QNT) price has crossed the moving average lines and is currently rising.
Quant long term price forecast: bullish
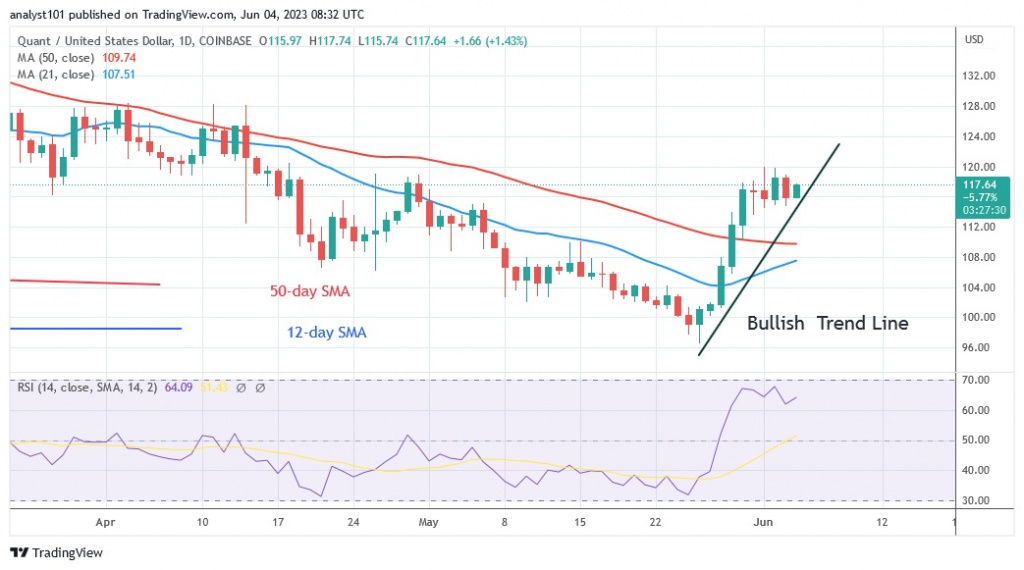
The uptrend has reached a high at $120. The uptrend has held at its recent high since May 30. In the last five days, price changes below the barrier have prevented the rise. The overbought zone of the market has now been reached by the crypto. At the time of writing, QNT is trading at $117. On the upside, the altcoin will face rejection if it reaches the high of $124 or $128. In the meantime, the upside was halted at the high of $120. On the downside, the altcoin will fall back to the breakout level of $112, where it will face rejection at the recent high.
Quant price indicator analysis
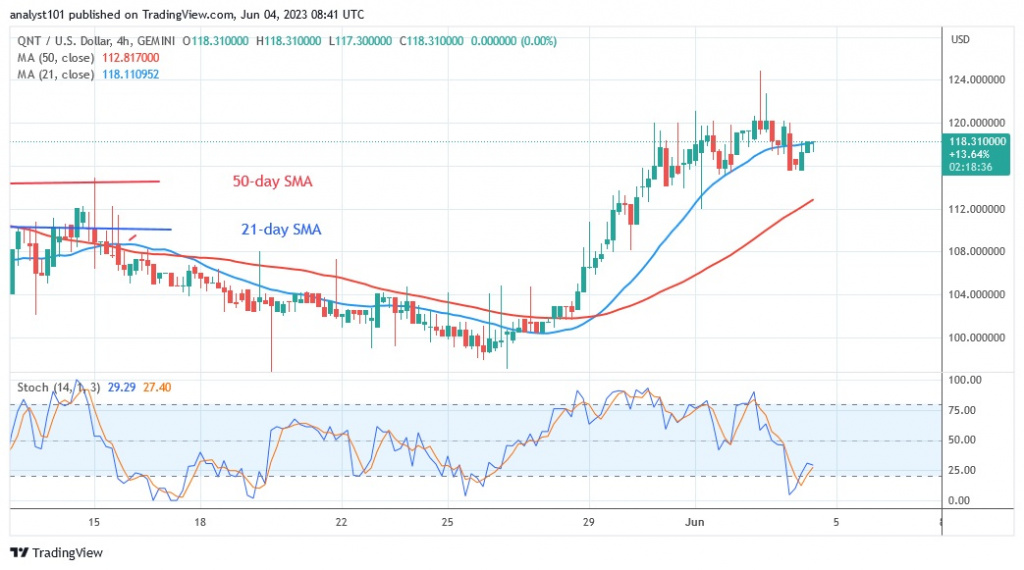
QNT is in the uptrend zone at level 64 of the Relative Strength Index for period 14. The altcoin has limited room to move as it approaches the overbought area of the market. QNT has the advantage of further upside as the price bars are above the moving average lines. The cryptocurrency will rise as it is in a bullish momentum above level 25 of the daily stochastic.
Technical Indicators
Key supply zones: $140, $150, $160
Key demand zones: $120, $110, $100
What is the next step for Quant?
The breakout above the moving average lines shows that the positive momentum of the cryptocurrency has returned. Within the shorter time frame, QNT has fallen within the moving average lines. The cryptocurrency will be forced to move between the moving average lines if it gets stuck there.
Disclaimer. This analysis and forecast are the personal opinions of the author and are not a recommendation to buy or sell cryptocurrency and should not be viewed as an endorsement by CoinIdol. Readers should do their own research before investing in funds.
Source: Read Full Article


