Polygon Recovers Above $1.00 But Struggles Below $1.16
Polygon (MATIC) has entered a bearish trend zone.
Polygon price long-term forecast: bearish
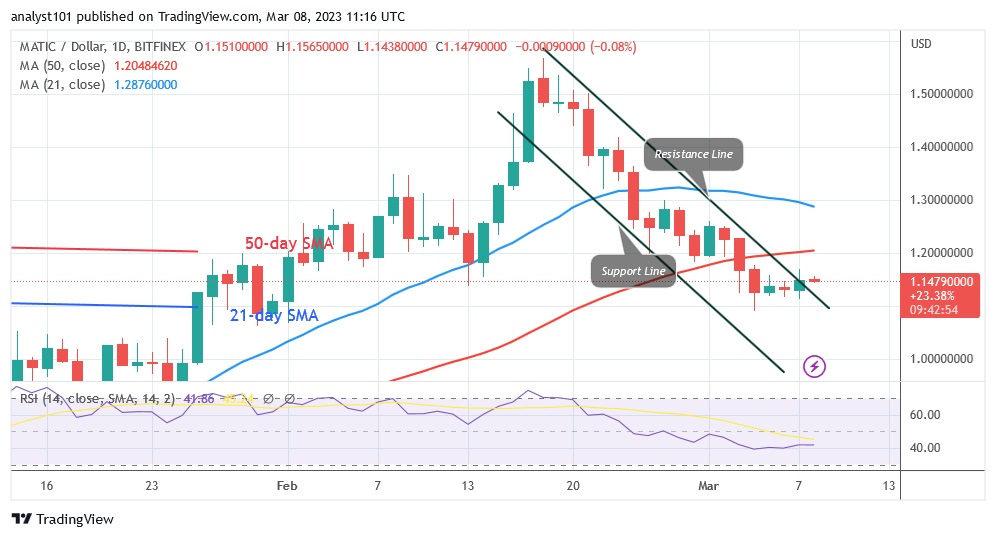
After the price decline on March 4, the current selling pressure has eased. The downtrend has shifted to a sideways movement. After falling to a low of $1.09, the cryptocurrency has been consolidating above the $1.00 support for the last four days. On March 7, the altcoin attempted to resume its uptrend, but encountered resistance at the high of $1.16. If MATIC recovers above the current support, it will resume its uptrend. A rally will break through initial resistance and rise above the 50-day simple moving average (SMA). The upward momentum will extend to the 21-day line SMA. If the current support is broken, the market will fall to the previous low above $1.00.
Analysis of the Polygon indicator
The Polygon indicator is in the bearish trend zone of the Relative Strength Index of the period 14 at the level 41. The MATIC has the potential to fall further within the downward trend zone. The price bar has remained below the moving average line, which is causing the current decline. MATIC is rising as it is above the stochastic level of 40 on the daily basis. The upward momentum has slowed down.
Technical indicators
Resistance levels: $1.20, $1.30, $1.40
Support levels: $1.00, $0.90, $0.80
What is the next move for Polygon?
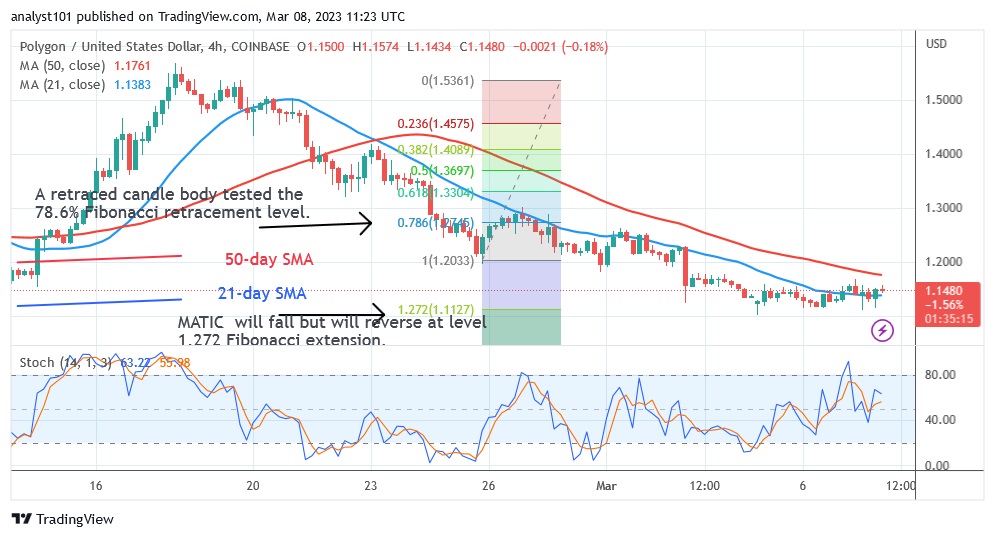
Polygon has fallen significantly and has reached the oversold zone of the market. On February 25, there was a downtrend. MATIC took an upward correction and the candlestick tested the 78.6% Fibonacci retracement level. The correction suggests that MATIC will fall and then turn around at the Fibonacci extension level of $1.272 and $1.11, respectively.
Disclaimer. This analysis and forecast are the personal opinions of the author and are not a recommendation to buy or sell cryptocurrency and should not be viewed as an endorsement by CoinIdol. Readers should do their own research before investing in funds.
Source: Read Full Article


