Litecoin Breaks Psychological Barrier But Remains in Bearish Territory: What Lies Ahead?
The recent surge in Litecoin (LTC) price propelled it to reach a significant psychological level of $100. This upward movement has provided a bullish boost and allowed the altcoin to register gains in recent trading sessions.
However, despite this bullishness, the price of LTC remains within bearish territory, indicating ongoing downward pressure. Reclaiming the $100 price mark is crucial for sustaining a bullish trend.
In the past 24 hours, LTC has experienced a rally of nearly 17%. On the weekly chart, the altcoin has maintained double-digit gains, reflecting its positive performance over a longer period.
It’s worth noting that Litecoin’s halving event is just a little over a month away. Historically, the price of the asset tends to increase before this event.
However, due to the fluctuating nature of Bitcoin, which often influences major altcoins, LTC might experience slight depreciation.
Significant depreciation is less likely as long as LTC maintains its price above the local support level. A sustained increase in demand for the altcoin is necessary to ensure continued gains on the daily chart. The market capitalization of LTC has also increased, indicating bullish momentum in the market.
Litecoin Price Analysis: One-Day Chart
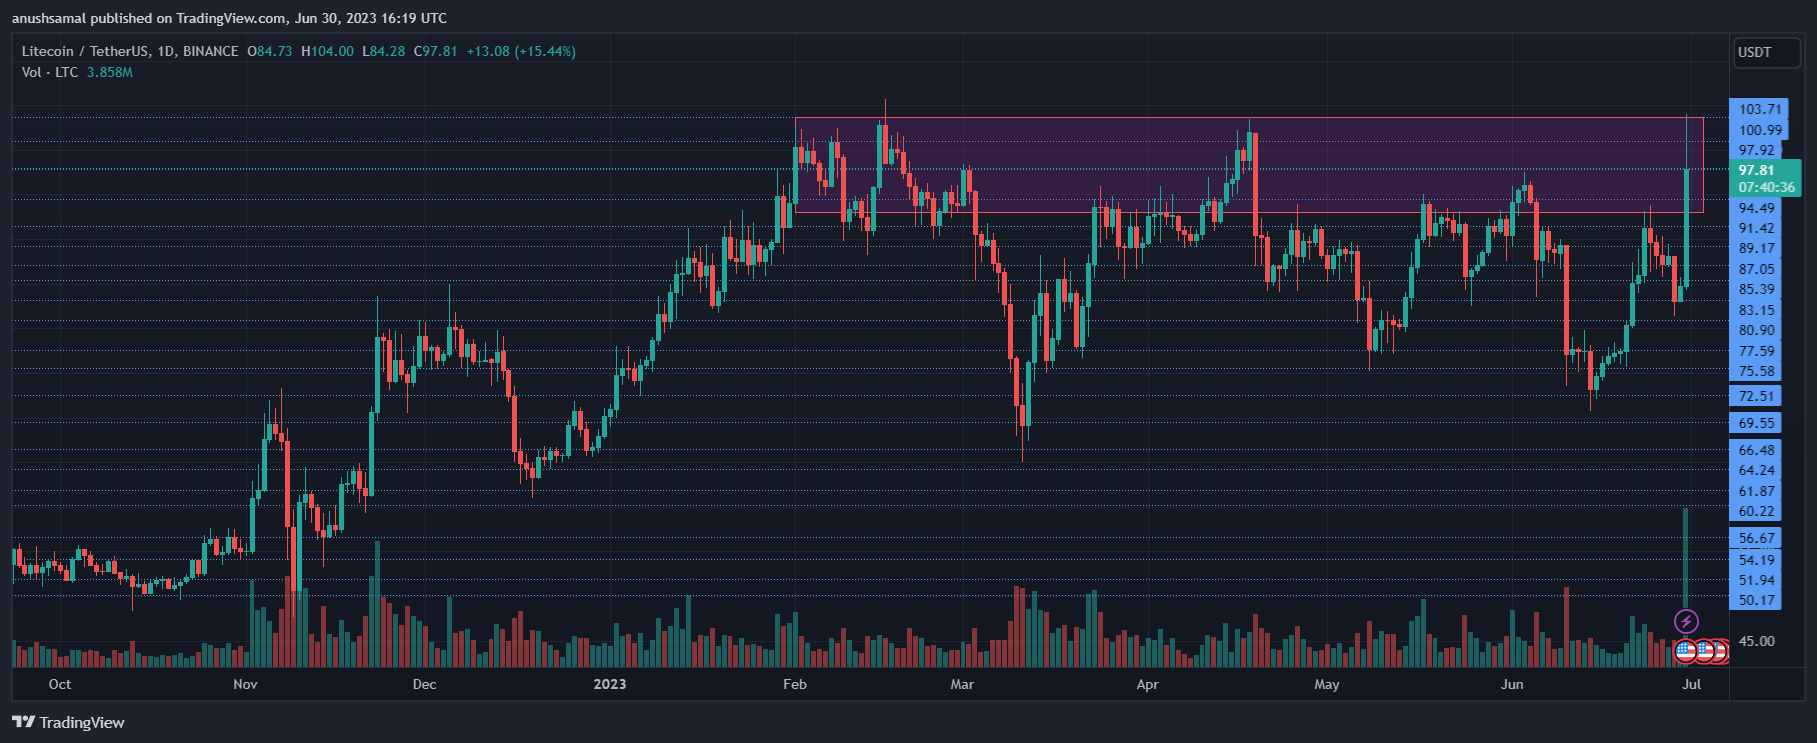
When writing, Litecoin (LTC) was trading at $97.81. After reaching the $100 mark, LTC has been steadily gaining in price. However, despite the bullish momentum, Litecoin remains within a crucial zone that is bearish and could potentially reverse the gains.
This bearish zone, indicated in red, extends from $94 to $103. In previous trading sessions, LTC has retraced when attempting to revisit the $103 level. The $94 mark has also been a reversal point over the past few months.
Moreover, Litecoin entered the excess selling zone the maximum number of times, where the price fluctuated between the two (upper and lower) bands of the bearish region.
The overhead resistance levels are $100 and $103. In case of a decline from these levels, the price could drop to $94 initially, followed by a potential further decline to $90.
Technical Analysis
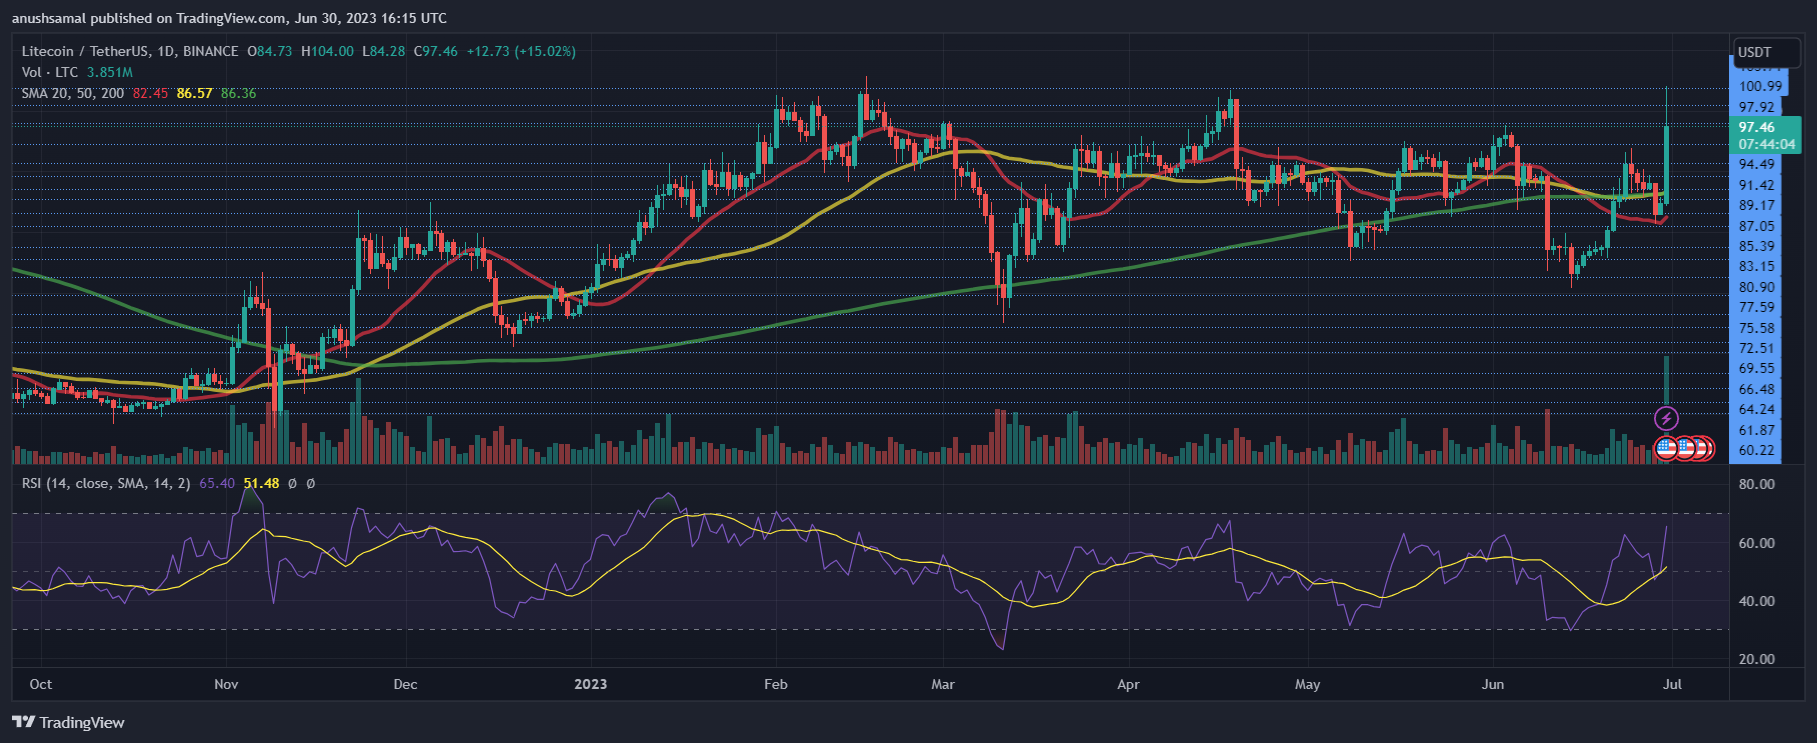
Regarding demand, Litecoin (LTC) was approaching overbought conditions. The Relative Strength Index (RSI) was above the 60 mark, indicating buyers had gained market control. This suggests a higher demand for LTC compared to selling pressure.
The increased demand was also reflected in the price, as it climbed above the 20-Simple Moving Average (SMA) line. This signifies that buyers were driving the price momentum in the market, pushing it higher.
As long as Litecoin (LTC) maintains its price above the 20-Simple Moving Average (SMA), indicated by the red line on the chart, specifically around the $87 level, the bullish sentiment is expected to persist.
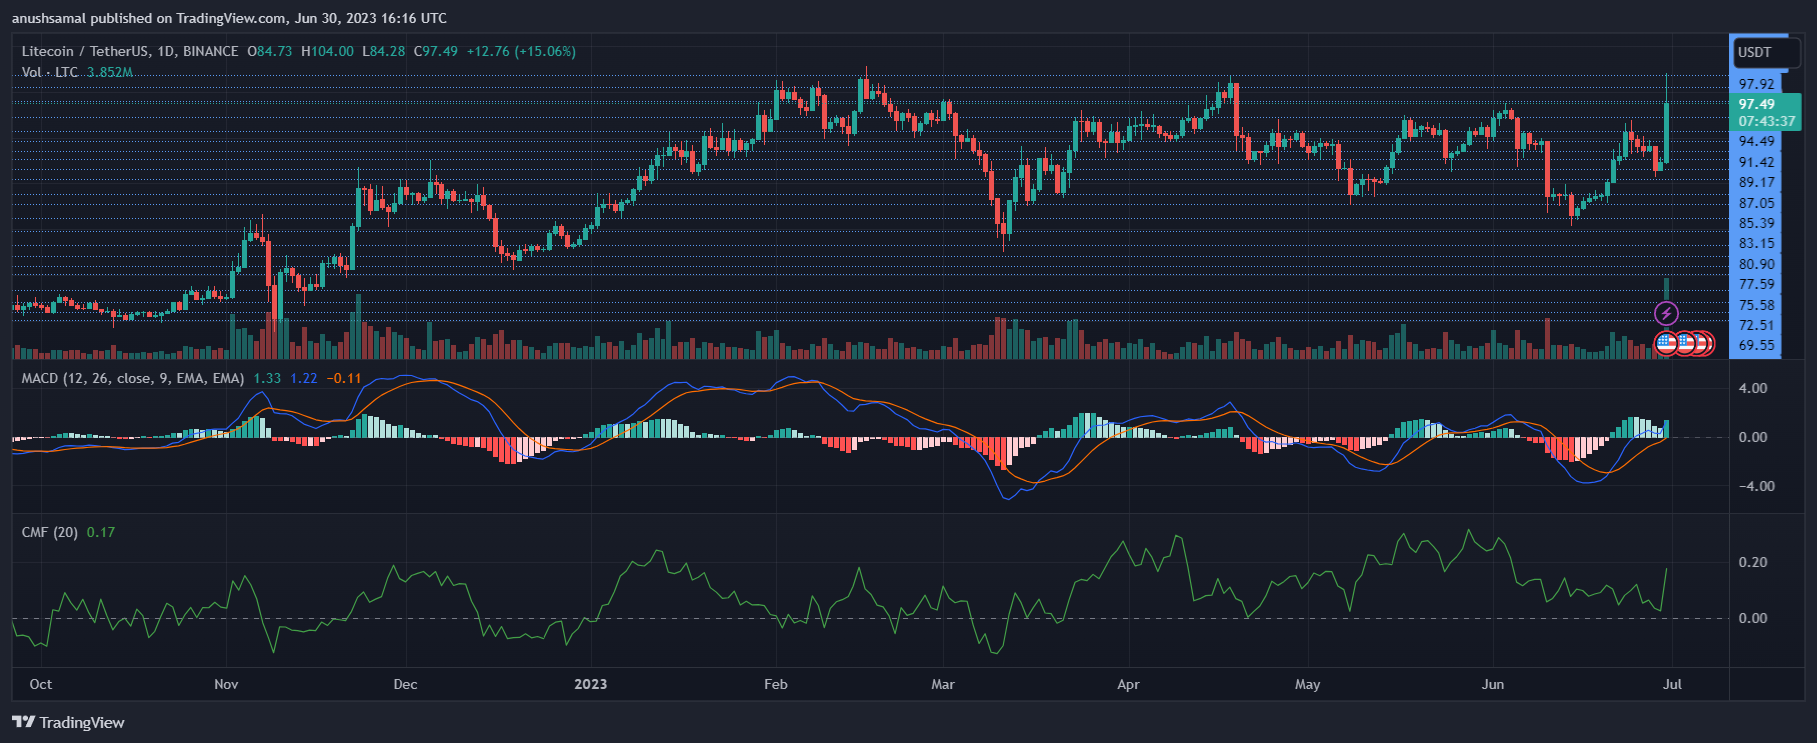
Litecoin (LTC) formed a strong buy signal in line with increased demand. The Moving Average Convergence Divergence (MACD) indicator showed a green histogram, indicating a fresh buy signal. This suggests a strong bullish momentum and strength in the LTC market.
Furthermore, the Chaikin Money Flow (CMF) indicator displayed capital inflows outweighing outflows. The indicator was above the half-line, indicating more capital inflows than outflows at the given time.
Source: Read Full Article


