Dogecoin Is In A Range And Struggling Below The High Of $0.078
Dogecoin (DOGE) has risen above the 21-day line SMA, signaling a positive trend.
Dogecoin price long term forecast: bullish
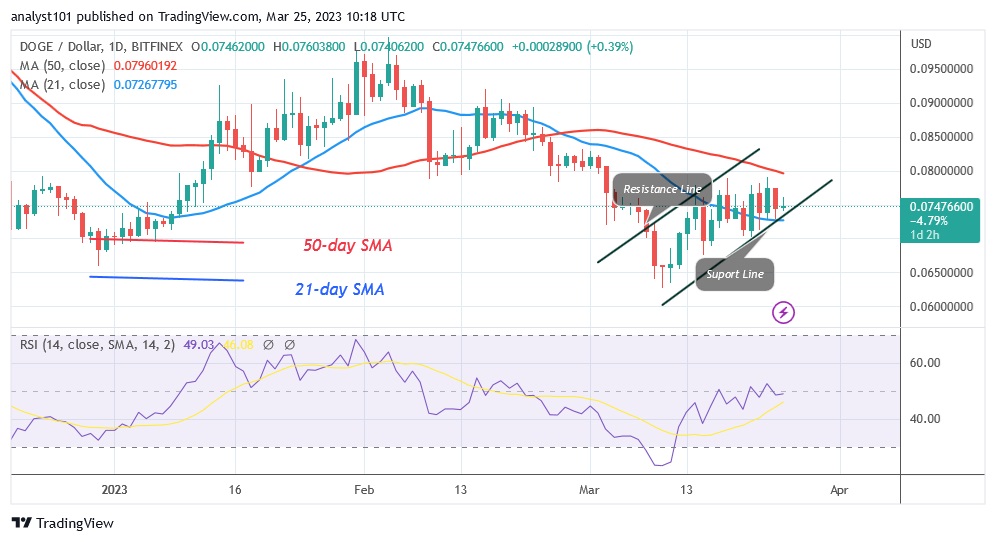
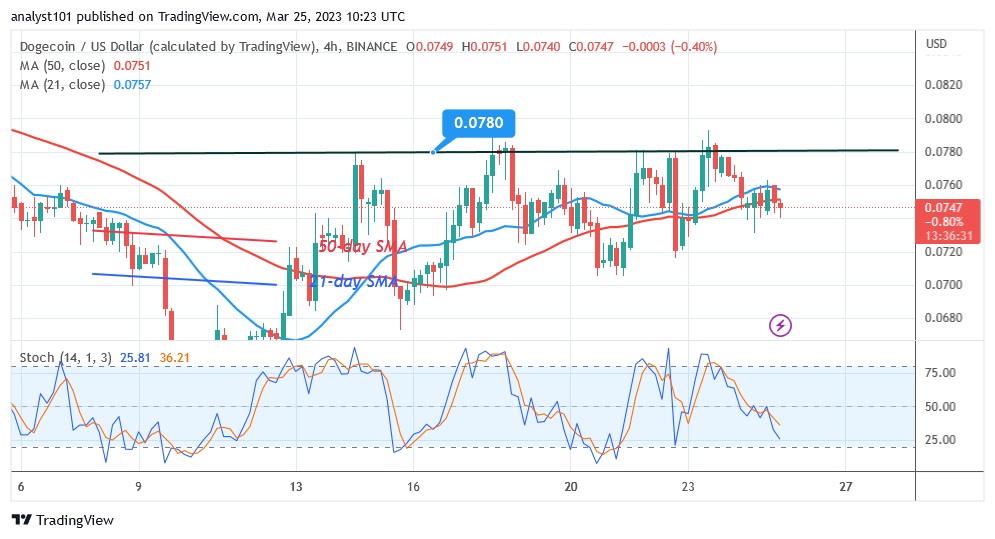
The $0.078 resistance level has been where the upward momentum has been since March 18. Moreover, the moving average lines have caught the price of DOGE. Nevertheless, it is currently trading below the 50-day line SMA and above the 21-day line SMA. This indicates that DOGE must be in a trading range for a short period of time. The trend will be upward if the price of the cryptocurrency exceeds the resistance at $0.078 and the 50-day line SMA. The altcoin will rise to a maximum of $0.09. Similar to the previous bottom, the market will drop to $0.065 if the price falls below the 21-day line SMA. The price of DOGE is currently moving within the moving average lines.
Dogecoin indicator display
In the Relative Strength Index for the period 14, DOGE is at the level 49. The RSI has not changed, but DOGE is between the moving average lines. The fact that the price bars are between the moving average lines shows that the price of the cryptocurrency fluctuates within a narrow range. The altcoin moves in the right direction when the daily stochastic threshold is above 25.
Technical indicators
Key resistance levels – $0.12 and $0.14
Key support levels – $0.06 and $0.04
What is the next direction for Dogecoin?
Dogecoin is moving sideways just below the $0.078 resistance level. The upside moves have been staved off frequently. The cryptocurrency is currently trapped between the moving average lines. When the moving average lines are crossed, Dogecoin will develop a trend.
Disclaimer. This analysis and forecast are the personal opinions of the author and are not a recommendation to buy or sell cryptocurrency and should not be viewed as an endorsement by Coin Idol. Readers should do their own research before investing in funds.
Source: Read Full Article


