Bitcoin Shows Recovery: Did This Historical Line Act As Support Again?
Bitcoin on-chain data suggests a historical support line may have helped the coin once again as the asset has recovered toward $28,000 today.
Bitcoin Short-Term Holder Cost Basis May Still Be Active As Support
According to data from the on-chain analytics firm Glassnode, the BTC price approached the cost basis of the short-term holders recently. The relevant indicator here is the “realized price,” which is a metric derived from the “realized cap.”
The realized cap refers to a capitalization model for Bitcoin that says that the value of each coin in the circulating supply is not the current spot price, but the price at which it was last transacted on the blockchain.
In this way, the model accounts for the price at which each investor acquired their coins. That is, their “cost basis.” When the realized cap is divided by the number of coins in circulation (to find a sort of average value), the aforementioned realized price emerges.
Related Reading: Bitcoin Exchange Inflows Mostly Coming From Loss Holders, Weak Hands Exiting?
This realized price signifies the average value at which each holder in the market bought their coins. The metric can also be defined for only partial segments of the market, like the “short-term holders” (STHs), in which case, the indicator will tell us about the average cost basis among this group only.
The STHs are all those investors who bought their coins less than 155 days ago. The BTC holders outside this group are termed the “long-term holders” (LTHs).
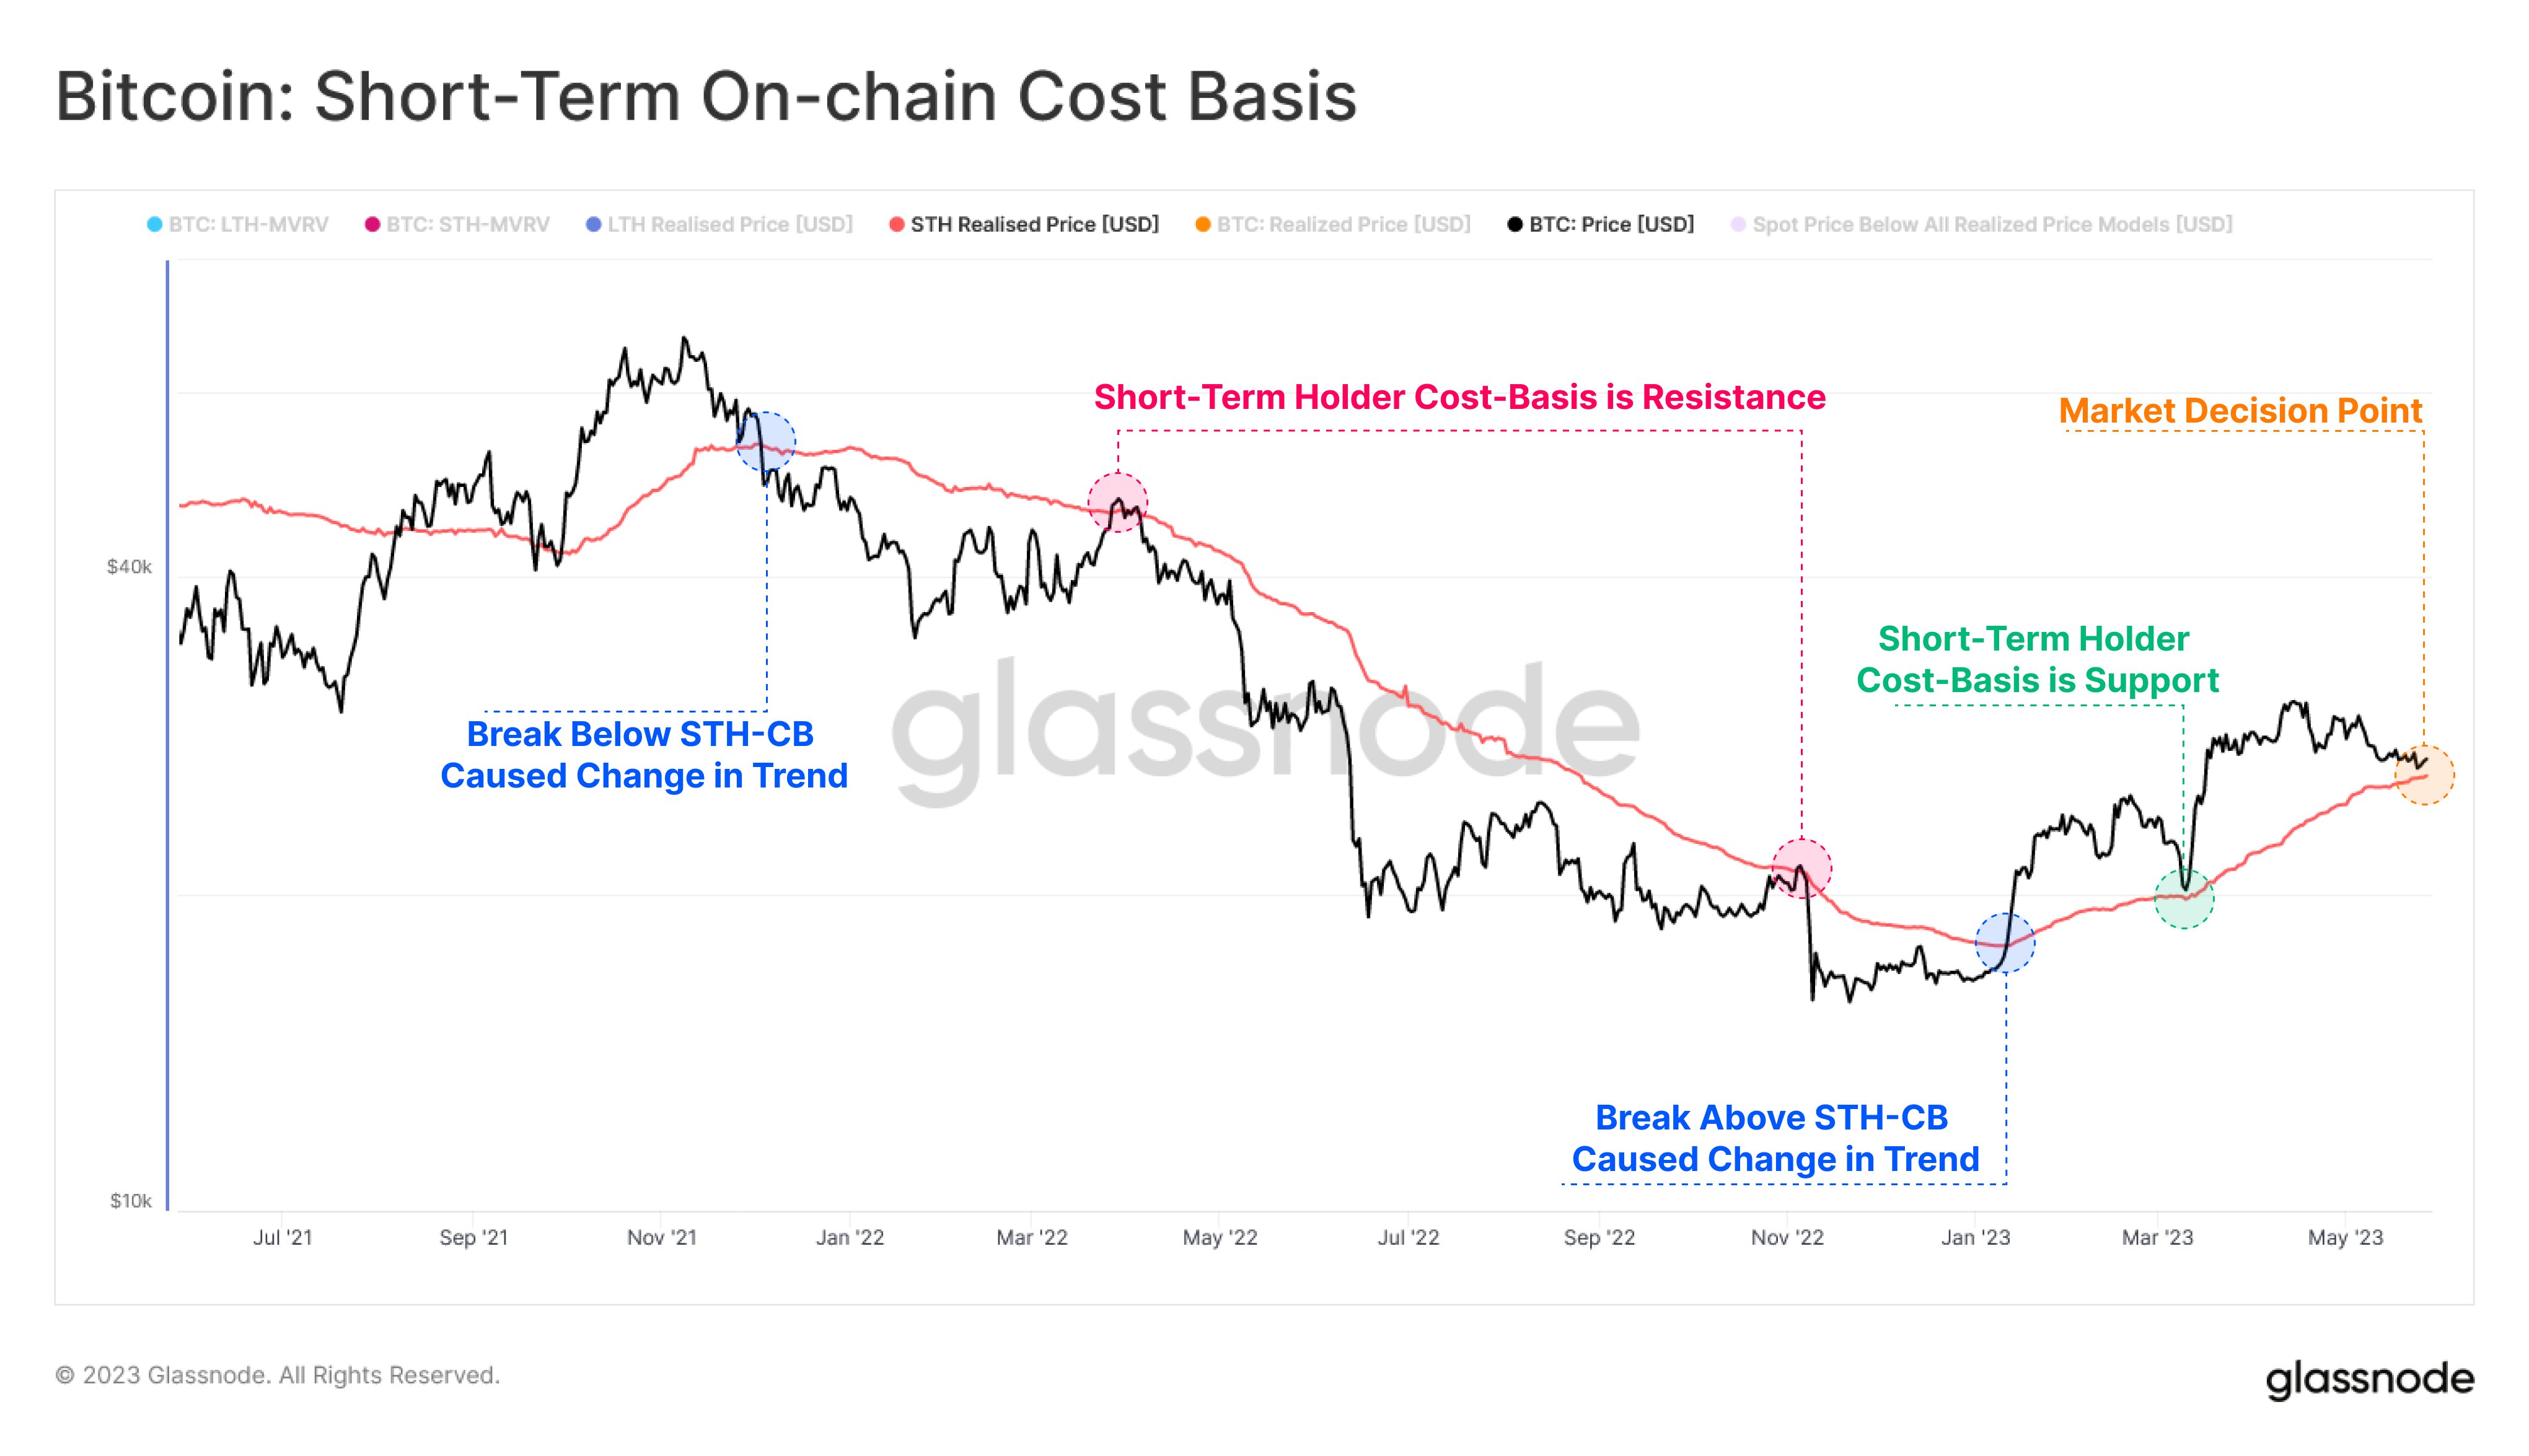
Now, here is a chart that shows the trend in the Bitcoin realized price for the STHs over the past couple of years:
The value of the metric seems to have been climbing in recent days | Source: Glassnode on Twitter
In the above graph, Glassnode has marked the various instances where the Bitcoin STH realized price has apparently interacted with the spot price of the asset. Back when the 2021 bull run topped out in November, the cryptocurrency’s value dropped below this indicator, signaling a change of trend.
From this point on, as the bear market took over, the STH cost basis started providing resistance to the asset. Back in January of this year, though, the price finally managed to break through this resistance as the rally began to take place.
Related Reading: Bitcoin Bulls Push BTC Back Up To $28K Amid Surging Address Activity
This break lead to another change in the wider trend, as the line seemingly turned into support for the asset. However, this isn’t an unusual pattern, as bullish periods have historically observed the metric helping the price.
Recently, Bitcoin found some struggle, as the price plunged towards the $26,000 level. The consolidation near this level meant that the price was fast approaching the STH realized price, which was slowly going up.
When Glassnode posted the chart yesterday, it described this current state as a “decision point” for the market. According to the analytics firm, a successful retest here would be a sign of strength in the bullish trend, while failure would imply weakness.
Over the past day, Bitcoin has enjoyed a rebound, with the price briefly breaking above the $28,000 level. But it may perhaps not be a coincidence that the uplift has come right as the price was nearing a retest of this historical level.
Naturally, a sustained move away from the STH realized price now would confirm that the level is still active as support, a sign that would be positive for the rally’s sustainability.
BTC Price
At the time of writing, Bitcoin is trading around $27,900, up 4% in the last week.
Source: Read Full Article


